Global IPO volume stood at US$99.1 billion (587 deals) in the first nine months of 2013, up 12% on the same 2012 period (US$88.2 billion) and the highest first nine months since 2011 (US$142.7 billion). [Statistics and some of the commentaries from Dealogic]
20 IPOs for an amount equal to, or greater than, US$1 billion equivalent accounted for 35% of the global IPO volume in the first nine months of 2013 (equivalent to US$34.4 billion), up from eight such deals in the same 2012 period (US$$38.1 billion), and the highest deal activity since 2007 (30 deals).
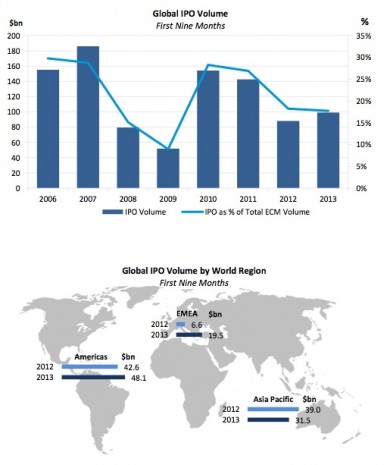
Regionally, Asia Pacific IPO volume stood at US$31.5 billion in the first nine months of 2013, the lowest volume since the same period in 2008 (US$20.5 billion). Only US$6.5 billion equivalent was raised via Chinese IPOs in the first nine months of 2013, the lowest level since 2003 (US$1.2 billion) as a result of the ongoing A-share freeze since October 2012.
EMEA IPO volume reached US$4.2 billion via 35 deals in 3Q 2013, more than twice the US$1.3 billion raised in 3Q 2012. Primary share offerings made up 49% of EMEA IPO volume in 3Q 2013 (US$2.0 billion), over three times the volume for the same 2012 period ($601m).
In the Americas, 3Q 2013 IPO volume stood at US$13.8 billion (72 deals) and was the highest 3Q volume since 2007 (US$24.6 billion, 86 deals). U.S. IPOs accounted for 88% of the total IPO volume in the region, the highest share since 3Q 2009 (94%).
For the first time since 1997, real estate IPOs (US$$18.1 billion, 67 deals) led the sector ranking in the first nine months of the year and accounted for 18% of global IPO volume, the highest share on record. The global IPO average one-month return was 17% in the first nine months, up from 14% in the same 2012 period, led by the U.S. technology sector, with an average return of 43%, the highest since 2003 (44%).
42 IPOs priced above their pricing range (largely a U.S. phenomenon, probably as a result of no pre-deal research publication being allowed there) and accounted for 7% of total IPO activity, the highest since 2000 (10%). IPOs below the range accounted for 9% (50 IPOs), the lowest since 2011 (5%).
IPO revenue totaled US$3.4 billion in the first nine months, up from US$2.8 billion in the same 2012 period. Revenue was boosted by U.S. IPO revenue of US$1.7 billion, the highest total since 2007 (US$1.8 billion) and at 51%, the highest share of global IPO revenue since the same 2002 period (50%).